Are you afraid of CSVs? Especially large ones? This ends today! I’ll show you few easy tricks to tame those and I guarantee (no refund though) you’ll start laughing at 400MB CSVs. Your computer processing power will be your only limit!

CSV, or Comma Separated Values, documents are just plain text documents with values separated by a specific character and, you guessed it, usually commas. They are incredibly common once you start exporting data from any tool. They open just fine in Excel with up to 1M rows and GSheets with up to 5M cells (I haven’t checked if the limits have changed). However, challenges start to arise when you have CSVs that are too big or multiple CSVs that require transformation or cleaning.
To tackle these challenges, we’ll use Python and a few useful libraries. You don’t even have to install anything, thanks to Google Colab: https://colab.research.google.com/ If you’re not familiar with the product, it’s a Google-owned service that allows you to launch Python scripts on your browser using Google Cloud resources for free (well, until you reach the quota, at least).
File>New Notebook, and you should have something similar to this
I will grab some random data on Kaggle (another Google service) for the dataset. I highly recommend Kaggle if you’re interested to play with data; few random examples:
- FIFA players from 2016 to 2022
- Rotten tomatoes movies and reviews
- Amazon Product Sales Dataset (2023, India) -> the one we’ll use here
The CSV files went in a personal Google Drive folder I made public for the demo: https://drive.google.com/drive/u/0/folders/1N1a0ZUBSc626r354sc3mADyq1yjq1FI0
In Colab, you can create two types of blocks: text or code, the text helps you organize your code blocks. I won’t be detailing the text blocks, do as you please, but only the code ones.
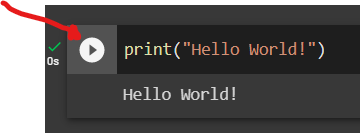
To run the script in a “Code” block, press the “Play” button next to it.
The first code block to create loads all libraries:
import pandas as pd
import os
from pydrive.auth import GoogleAuth
from pydrive.drive import GoogleDrive
from google.colab import auth
from oauth2client.client import GoogleCredentials
from google.auth import default

auth.authenticate_user()

gauth = GoogleAuth()
gauth.credentials = GoogleCredentials.get_application_default()
drive = GoogleDrive(gauth)
Merge multiple CSVs into one
Next, we will parse the Google Drive Folder and load all CSV files in one giant table (technically a Pandas Dataframe)
Note: If you are interested in Python and data, Pandas is a VERY important library to master!
You can start here: 10 minutes to Pandas
#GET THE DATA FROM DRIVE
#id is the last part of the GDrive URL slug, here:
#https://drive.google.com/drive/u/0/folders/1N1a0ZUBSc626r354sc3mADyq1yjq1FI0
file_list = drive.ListFile(
{'q': "'1N1a0ZUBSc626r354sc3mADyq1yjq1FI0' in parents"}).GetList()
download_path = os.path.expanduser('~/data') #the folder on the virtual machine
try:
os.makedirs(download_path)
except FileExistsError:
pass
bigdf = pd.DataFrame #creates an empty dataframe
for f in file_list:
print('title: %s, id: %s' % (f['title'], f['id']))
output_file = os.path.join(download_path, f['title'])
temp_file = drive.CreateFile({'id': f['id']})
temp_file.GetContentFile(output_file)
data = pd.read_csv(output_file)#, encoding = 'unicode_escape')
print(f'Data = {len(data)} rows')
if bigdf.empty:
bigdf = data
else:
bigdf = pd.concat([bigdf,data])
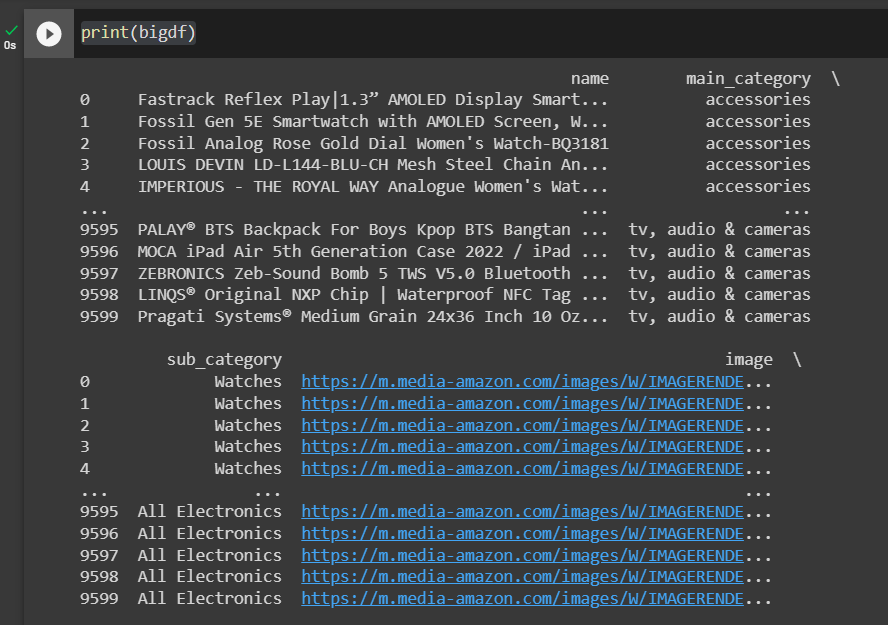
print(f'Big DF = {len(bigdf)} rows')You can already run the script.
It took 14 minutes, but the Dataframe now has 1,103,170 rows which is the result of 140 CSV files (!!!) combined. Not even a drop of sweat.

Download the CSV file
If you were only interested in merging a few CSVs, you can download the Dataframe to a single CSV using those few extra lines of code (in a new Code block so you can run it only if you want to).
from google.colab import files

bigdf.to_csv('df.csv')
files.download('df.csv')
But that’s a shame to stop here! Let’s play around with the data.
Explore the CSV: Check the size, list the fields
You can always have a quick look at your dataset with a simple print(); by default, it will only show the first and last 5. It’s a very convenient way to check if the data looks good and what fields are present.
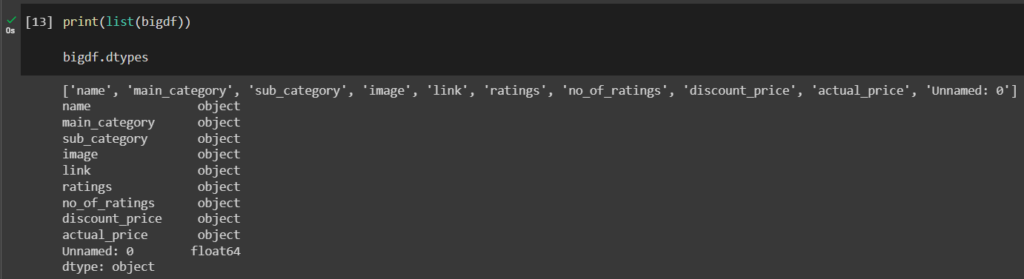
If you’re only interested in checking the fields, few options (see screenshot below):
- Print the columns name as a list
- I like using dtypes because it provides more information. Here they were not appropriately detected and all tagged as ‘object’, most likely because they require some cleaning. It’s important because if you want to use operations on them, you might have to change each type to whatever it needs to be: string, float, date, etc.
Some Cleaning First
Datasets often (always?) require some clean up, it becomes even more true for large ones. That one is no exception; as expected, we have to mess with the data types too. The following code should be pretty straightforward:
#some cleaning to remove erroneous values
bigdf['ratings'] = pd.to_numeric(bigdf['ratings'],errors='coerce').fillna(0)

#it looked like pandas was not happy with the ',' for thousands so we just replace and convert, if error we add '0'
bigdf['no_of_ratings'] = bigdf['no_of_ratings'].replace([','], [''], regex=True)
bigdf['no_of_ratings'] = pd.to_numeric(bigdf['no_of_ratings'],errors='coerce').fillna(0)

#converting to the right type so we can apply the filters
bigdf = bigdf.astype({'ratings': float})
bigdf = bigdf.astype({'no_of_ratings': int})

#keeping only the wanted columns and copying in a new dataframe 'cleandf'
cleandf = bigdf[['name', 'main_category', 'sub_category', 'link', 'ratings', 'no_of_ratings', 'discount_price', 'actual_price']]
Filter the data
Now we have a million cleaned rows to analyze; we might want to cut a lot of the noise and reduce the size of the dataset to something a human would be able to actually look at.
For example, we only want a list of the top-rated products.
#Top rated products
toprateddf = cleandf.loc[cleandf['ratings']>4.5]
print(toprateddf)
The first filter returns 98,904 results. Not bad considering we are querying 1M+ rows.

Still a lot, and we can remove more noise by looking only at the products with at least 1,000 reviews:
#same but we only want the ones with at least 1,000 reviews
toprated2_df = cleandf.loc[(cleandf['ratings']>4.5) & (cleandf['no_of_ratings']>1000)]
print(toprated2_df)
3,636 results, yay! 🥳
Calculated Fields
Why stop here? We have a computer doing the heavy lifting for us, so let’s take full advantage of that. It’s effortless to create new columns in a Dataframe using other columns values.
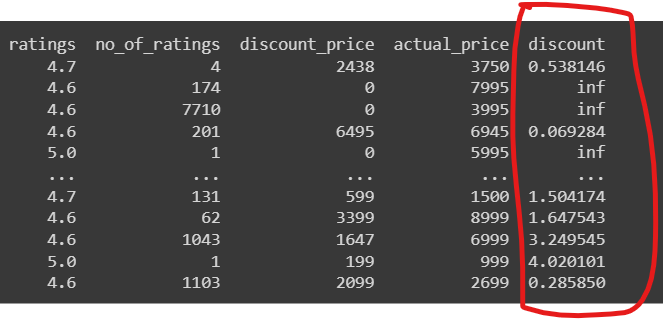
In our case, we have the actual price and the discount price. We want a new column with the discount%
toprateddf['discount'] = toprateddf['actual_price'] / toprateddf['discount_price'] - 1
The result if you print():
if you want the result to look like a percentage (I don’t recommend it since it will convert the field into a string and prevent any further operations like sorting or filtering by value)
#will convert '0.2858' (float) to '28.58%' (string)
toprateddf['discount'] = toprateddf['discount'].mul(100).round(2).astype(str).add(' %')
Read more: How to create new columns derived from existing columns
What did you learn?
I started the post as an SEO use case to assess traffic opportunities by content cluster, which requires combining and manipulating CSVs (as many CSV as competing domains you want in your analysis). But I felt starting with a quick introduction was better; stay tuned for the next post.
Hopefully, you now understand the basics of manipulating big-ish datasets. The potential is huge! There’s a learning curve to Pandas for sure, but it’s 100% worth your time if you’re often dealing with data (and if you’re here, I guess you are).
Link to the Google Colab (might not be as cleaned as the code you found above): https://colab.research.google.com/drive/1TxS1TmGAQ0cIRDdex9JDlhCnH4QyzaDn?usp=sharing
Was this helpful?
0 / 0

SEO/Data Enthusiast
I help international organizations and large-scale websites to grow intent-driven audiences on transactional content and to develop performance-based strategies.
Currently @ZiffDavis – Lifehacker, Mashable, PCMag
ex @DotdashMeredith, @FuturePLC