If you have been doing SEO for over three days, you had to answer that question in appearance simple yet very complex:
“How is that page ranking?”
Let’s find out the most appropriate answer and how to leverage the rankings into a data-driven content strategy.
What is your definition of “ranking”?
It is generally assumed that “ranking” means “organic position in Google SERPs”.
Behind this straightforward definition hides some more challenging questions
- What keyword are we talking about?
- How to choose the right keyword? Highest MSV? best match with the intent?
- Is it one or several keywords?
- If more than one keyword,
- Variations only or different intents?
- Average position or Weighted average?
- What tool are you using for measurement? (different definitions of ranking by tool below)
- etc…
The good news is that if people come to you with that question, you get to decide the answer.
Choose the most convenient metric for you
Depending on the tool, the ranking will be defined differently. There’s no wrong answer; pick one.
Here are a few examples: (or skip to the good part: Use rankings to measure Success and Opportunities)
Google Position according to Google Search Console
A Google Search results page is composed of many search result elements. The “position” metric is an attempt to show approximately where on the page a given link was seen, relative to other results on the page. In Search Console, the metric is shown as average position, which averages the position value for all impressions (because the position of the link will be different each time it is seen).
https://support.google.com/webmasters/answer/7042828?hl=en#position
Average Position: The average ranking of your website URLs for the query or queries. For example, if your site’s URL appeared at position 3 for one query and position 7 for another query, the average position would be 5 ((3+7)/2).
https://support.google.com/analytics/answer/1308626
If you want a few more subtilities from John Mueller:
Google Ranking by STAT
Google base rank: In STAT, Google base rank excludes all universal search results (i.e. blended results like places, news, images, video, and so on), with the exception of featured snippets which are assigned a base rank of 1 instead of no base rank. For example, if STAT reports a Google rank of eight but a Google base rank of five, this indicates that there are three universal results ahead of your site on the SERP. (See also organic search results and Google organic rank.)
Google rank (Google organic rank): In STAT, Google rank (or Google organic rank) includes all standard and universal search results (like places, news, images, answers, video, and so on). (See also Google base rank.)
https://help.getstat.com/knowledgebase/glossary-of-stat-terms-and-metrics/
TL;DR
Base rank = the position within the blue links
Google rank = ‘true’ position, including all results (news, images etc.)
Google Position by SEMrush
The position an analyzed domain gets in organic search results for a given keyword over a specific period of time.
See also: Why are my Position Tracking results different in Google?
Google Position by ahrefs
“The top position your target ranks for in the organic search results for a keyword. Positions might be shown as “lost” in cases where your target stops ranking for this keyword, or if its keyword volume is so low that we stopped updating it.”
Also interesting is the note about discrepancies you might notice.
It’s important to note that there’s no such thing as a truly “objective” position. You should always expect some discrepancy due to factors such as:
source
- Volatility of ranking results;
- Time lag between ranking update and manual checking;
- Personalisation of search results.

Rankings to Measure Success and Opportunities
Now we have mastered the nuances of rankings and picked one tool to measure; it’s time to use the data in your content strategy.
- A measure of success: Ranking #1 on a single keyword is an easy goal to picture. It’s a simplistic approach that assumes the efforts to rank for that specific keyword would also benefit all other highly relevant keywords.
- A tool for prioritization: We can extrapolate the current performance of that keyword to estimate the traffic potential for the page and prioritize the efforts
Example:
example.com/best-ads-superbowl-LVII (Title = ‘Best Ads of Super Bowl 2023’ ) ranks #8 for ‘best ads superbowl 2023’
You can easily conclude:
– The page can be optimized (assuming you know your domain can rank #1).
– Based on current traffic, you can estimate its potential if it would rank #1
Note: If you intended to rank for ‘best commercials (…)’ that’s not what the title says, so it’s irrelevant. Change the title, the copy AND the target keyword.
1. Pick a (Target) Keyword
The target keyword is the primary intent for the page and, therefore, usually a very close match of your <title>. Don’t bother getting the highest search volume; it will only make the intent vaguer.
Probably the most tedious part because, in my experience, nothing (yet) replaces a manual review.
Note: I’d be more than happy to have this belief challenged by some AI (less work yay), but I haven’t found a good way yet. When doing it at scale, I got better results using a “fuzzymatch” against the H1/Title tags… but that’s for another post!
e.g. What is a good target keyword?
- URL: example.com/best-ads-superbowl-LVII
- Title: ‘The Best Super Bowl Commercials of 2023’
- a Good target keyword would be: “best super bowl commercials 2023”
- Wrong target keywords:
- superbowl ads (‘ads’ instead of ‘commercials’, too vague: what year? all time?)
- super bowl commercials LVII (the title is targeting 2023, a quick Google search indicates the results are different for LVII and 2023 variations, if not, both would be acceptable)
Depending on the number of pages you have, you want to use different methods:
- Start by defining your first X critical pages manually: it takes time, but it’s worth it, IMO. Recently, I was able to define 4,000 keywords by myself in a couple of months whenever I had some time. (in batches of 100s, so I didn’t lose my sanity)
- Build a mandatory field in the CMS to ensure every new creation and update has a keyword attached. If you’re not the one doing it, you need to train whoever will be filling in the information. Important: not every content requires a target keyword (e.g. news)
- For large-scale websites, backfilling is a real challenge, and you will need to be creative and patient
- Leverage the regular expressions functions in Google Sheets to extract patterns from titles whenever it’s possible e.g. ‘best X for Y’
- Build a script to compare the top GSC keywords and the title/h1
2. Report Performance
Now you have a growing list of pages matched with a target keyword, you can work on building your reports.
Few ideas:
- I’m a huge advocate for providing lists of content to editors so they know what they are responsible for and how it performs. (I realize how obvious it sounds, but it didn’t exist in any of the companies I worked for, so I guess it’s unfortunately not standard practice)
- The report should include basic information e.g. URL | title | past 28d traffic | %mom
- and actionable metrics e.g. days since the last update, and target keyword + ranking
- Use filters on the data to create views: e.g. Top performers, to update, low-hanging fruits etc.
- Count of Top 3 Rankings: by content type, category, etc. A period-over-period variation is also an excellent indicator of how well you’re ranking and more indicative of the search performance than traffic, which is more volatile.
3. Prioritize by opportunities
Probably the most exciting part and certainly the most rewarding. That’s also what justifies putting the time and effort into such project.
The data below is from a real website; only anonymized:
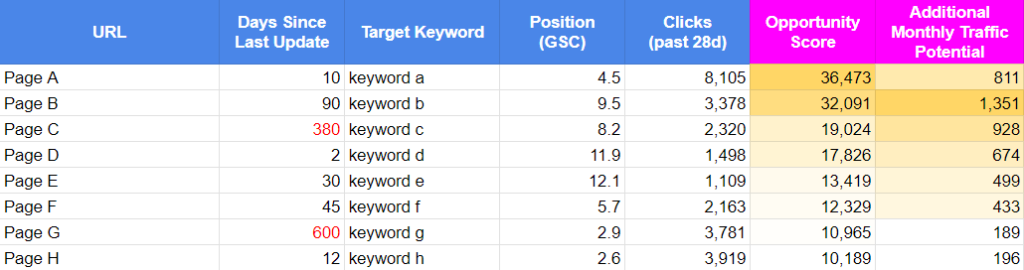
You can create your own formula to calculate the opportunity, here are a few examples:
- The opportunity score, as calculated above, is traffic * current position on the target keyword. It is not traffic but a traffic score weighted by its rank and could be used to sort the opportunities.
- Another way that might feel less abstract is to calculate the potential traffic gain if the page would rank #1. Again, several methods:
- Here (last column), I applied an arbitrary %gain based on the current position.
- In other cases, I calculated a potential score based on SERP CTR (your own or industry averages)
- Use your own formula. You can add weights by keyword difficulty, last refresh, or whatever makes the most sense for you.
- You can easily create actionable views for updates e.g.
- Ranking #1 -> Skip (knowing where NOT to invest time is equally important)
- Ranking #12, not updated in a year -> low-hanging fruit
- Ranking #6, updated recently -> flag, requires second look
- etc.
Hopefully, this data-driven approach will help you increase the ROI of your content updates. I’ve been using it with a few variations for a while now, and it has proven to be successful when scaled properly. Let me know if you have any feedback about it; I’d love to hear your thoughts.
Was this helpful?
1 / 0

SEO/Data Enthusiast
I help international organizations and large-scale websites to grow intent-driven audiences on transactional content and to develop performance-based strategies.
Currently @ZiffDavis – Lifehacker, Mashable, PCMag
ex @DotdashMeredith, @FuturePLC