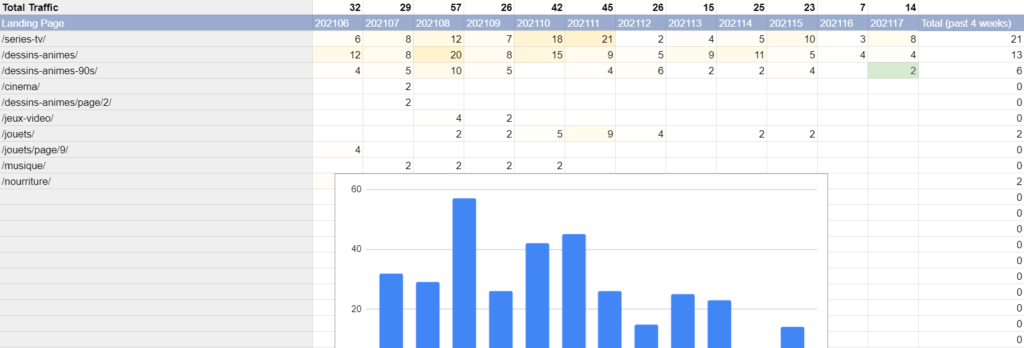
Let’s cover the basics with a quick dashboard I use a lot as a starting point for many performance analyses or keyword research, audit etc.
The document is showing the list of landing pages and the entrances by day/week for the filter you want.
For example, you can set up the report to provide automatically a daily update of your search performance for your content tagged X + a chart for a quick overview. Now, you can expand this report to cover other tags and make it a report by section of your site you can share with section editors: e.g. ‘Gaming performance report’ spreadsheet and different sheets for each game, mobile section by brand/model… etc. your GA setup is the limit.
If you’re not interested in the details, here’s a direct link to the report:
https://docs.google.com/spreadsheets/d/161D8Et6r1KrGOTJuS9qTAEQpmIg5CgAnk0iwRjGEUMo/edit?usp=sharing
Step 1: Setup a report with the Google Analytics plugin for Google Sheets.
If you’re not familiar with the tool, I would strongly advise starting using it. I can imagine my (work) life without it. If you don’t have it already here’s the link to install: https://workspace.google.com/u/0/marketplace/app/google_analytics/477988381226?hl=en&pann=sheets_addon_widget
In the menu: Add-ons > Google Analytics > Create a report
You can use the form to generate your report but I suggest filling the data directly in the Sheet “Report Configuration” created. Once you have it you can duplicate it in other report and start from there.
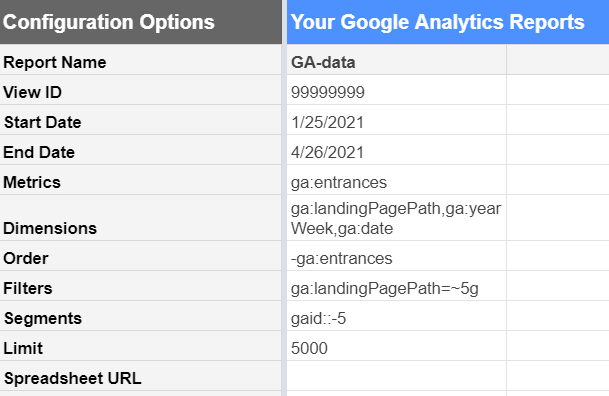
Report Name: This will be the name of the new sheet with your data (must be unique)
View ID: your GA view ID
Start Date: (gsheet formula to get the past 13 weeks) =B5-7*13
End Date: (gsheet formula for yesterday) =TODAY()-1
Metrics: ga:entrances
Dimensions: ga:landingPagePath,ga:yearWeek,ga:date
Order: -ga:entrances (entrances descending order)
Filters: ga:landingPagePath=~5g|4g (= regex for ‘contains 4g or 5g’)
Segments: gaid::-5 (default GA ID for Organic Search)
In the menu: Add-Ons > Google Analytics > Run Reports
More:
You can check more filters options here: https://developers.google.com/analytics/devguides/reporting/core/v3/reference#filters
Must-have tool to get the ID of your custom dimensions, Segments etc. https://ga-dev-tools.appspot.com/query-explorer/
Step 2: Create the Queries
Now you should have a new sheet named whatever you added in the ‘Report Name’ with your precious data. We’ll use my favorite Google Sheet function to transform that data into something actionable.
Create a new sheet ‘Traffic by Week’
in the B2 cell (not A2, we need that first row later) copy/paste:
=query(
query('GA-data'!A15:D,"select A,sum(D) where A is not null and C < date '"&text(TODAY()-WEEKDAY(TODAY()),"yyyy-mm-dd")&"' and C > date '"&text(TODAY()-WEEKDAY(TODAY())-12*7,"yyyy-mm-dd")&"' group by A pivot B")
,"select * order by Col13 DESC",1)
Few notes:
- ‘GA-data’ is the report name I used in the Report Configuration.
- It gets all data from the A15 cell of that sheet which is the default starting cell for the data (double-check for it to make sense)
- ‘select A, sum(D)’ landing pages + the sum of entrances (by landing pages cf. ‘GROUP BY’ further down)
- ‘where A is not NULL’ helps the query not to use the empty cells in the A15:D range
- the date part is a bit confusing mainly because Google requires to use the word ‘date’ whenever you’re making a date comparison. Here it says: every week for the past 12 weeks (~3 months)
- ‘group by A’ here the landing pages
- ‘pivot B’ the week of year
- that query is nested in another query so you can sort the result by the last column (i.e. the latest week data) – notice that I can’t use the column names here (‘Column13’ instead of ‘M’ – more information below)
More about QUERY():
For those who are interested, here’s a quick and complete lesson for the Google Sheets QUERY function. This is my go-to cheat-sheet. https://codingisforlosers.com/google-sheets-query-function/ Another tool I couldn’t live without today.
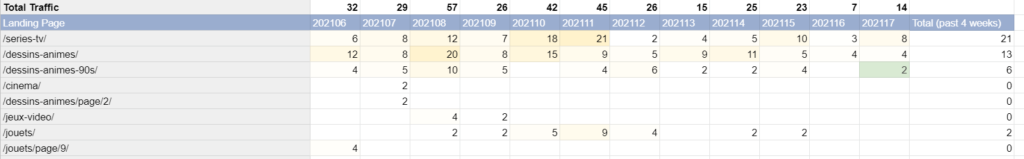
Congratulations ! You already have a list of your traffic by week for the segment you want.
Step3: Add a subtotal on the first row + Chart
This is why I needed the first row.
- In A1 you can type “Traffic by week”
- the next 12 columns are just the sum of the entrances by week A2 will be =SUM(B3:B) and you can pull the formula to the other columns on the right
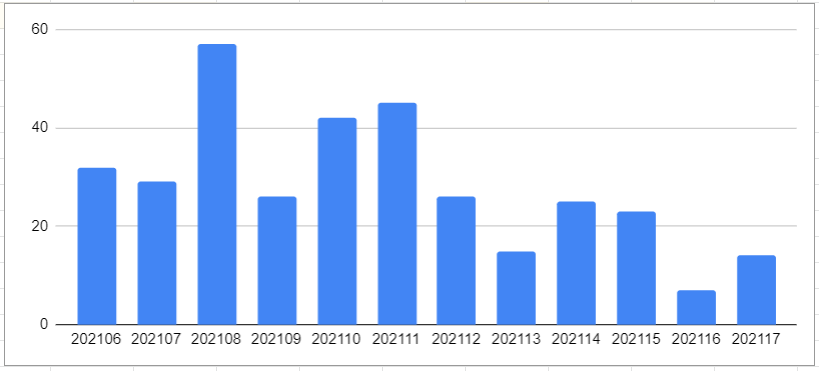
For the chart, use a ‘column chart’ with the following options:
- Data range: B1:M1,B2:M2
- Combine Ranges: Vertically
- Stacking: None
- X-Axis: B2:M2
- Series: B1:M1
- Switch rows/columns
Step 4: ‘by day’ Sheet
Create a new sheet ‘by day’
cf. step 3, only the query is different:
=query(query('GA-data'!A15:D,"select A,sum(D) where A is not null and C > date '"&text(TODAY()-14,"yyyy-mm-dd")&"' group by A pivot C"),"select * order by Col14 DESC",1)
Step 5: Duplicate, Automate and enjoy
Here’s a dummy template I created with one of my old website you can make a copy of (File > Make a copy): https://docs.google.com/spreadsheets/d/161D8Et6r1KrGOTJuS9qTAEQpmIg5CgAnk0iwRjGEUMo/edit?usp=sharing
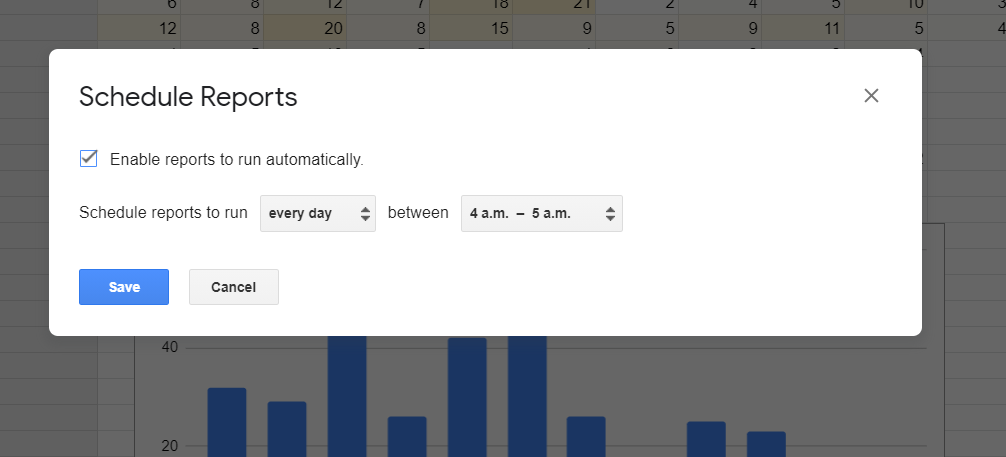
Schedule the reports to run every night so it’s up to date when you start your day:
Add-Ons > Google Analytics > Schedule Reports
Feel free to upgrade, optimize, change, make a data studio connection…
Was this helpful?
0 / 0

SEO/Data Enthusiast
I help international organizations and large-scale websites to grow intent-driven audiences on transactional content and to develop performance-based strategies.
Currently @ZiffDavis – Lifehacker, Mashable, PCMag
ex @DotdashMeredith, @FuturePLC